How the Page Cache Affects Read and Write Latency
Dirty-page thresholds can turn fast buffered writes into stalls without warning.

The Linux page cache sits between every application and every disk, and it decides almost all the latency numbers a team actually sees in production. Nobody sets out to learn how it works. Usually it's a 3 AM page about "random" write stalls that forces the issue.
How cache hits and misses map to the latency numbers developers see
A cache hit is boring, in the best way. The kernel already has the 4 KB page sitting in RAM, so it hands it back with no disk involved. A buffered write into that cache runs around 9,000 nanoseconds under normal memory conditions, based on published fio latency benchmarks. Fast.
A miss is the opposite story. The kernel has to go fetch the page from disk, load it into memory, then hand it to the app, and that round trip drags in disk I/O, a page fault, and a couple of context switches along the way. None of those steps are slow individually, but stack them up and the latency jumps by orders of magnitude compared to a hit.
Everything moves in 4 KB chunks, which produces a smaller, sneakier cost in how the cache is organized. Asking for a small slice of a database row means the kernel still pulls the whole 4 KB page around it. If your access pattern has good spatial locality, that's free lunch, the extra data probably gets used soon. If it doesn't, and a lot of real-world query patterns don't, that extra data just sits there wasting bandwidth for nothing.
If your working set fits in RAM, the page cache is close to magic. If yes, the page cache is close to magic. If no, performance falls off a cliff, and it doesn't fall gently. Reads have one real failure mode, the miss. Writes, as it turns out, have two.
The dirty-page thresholds that turn fast writes into stalls
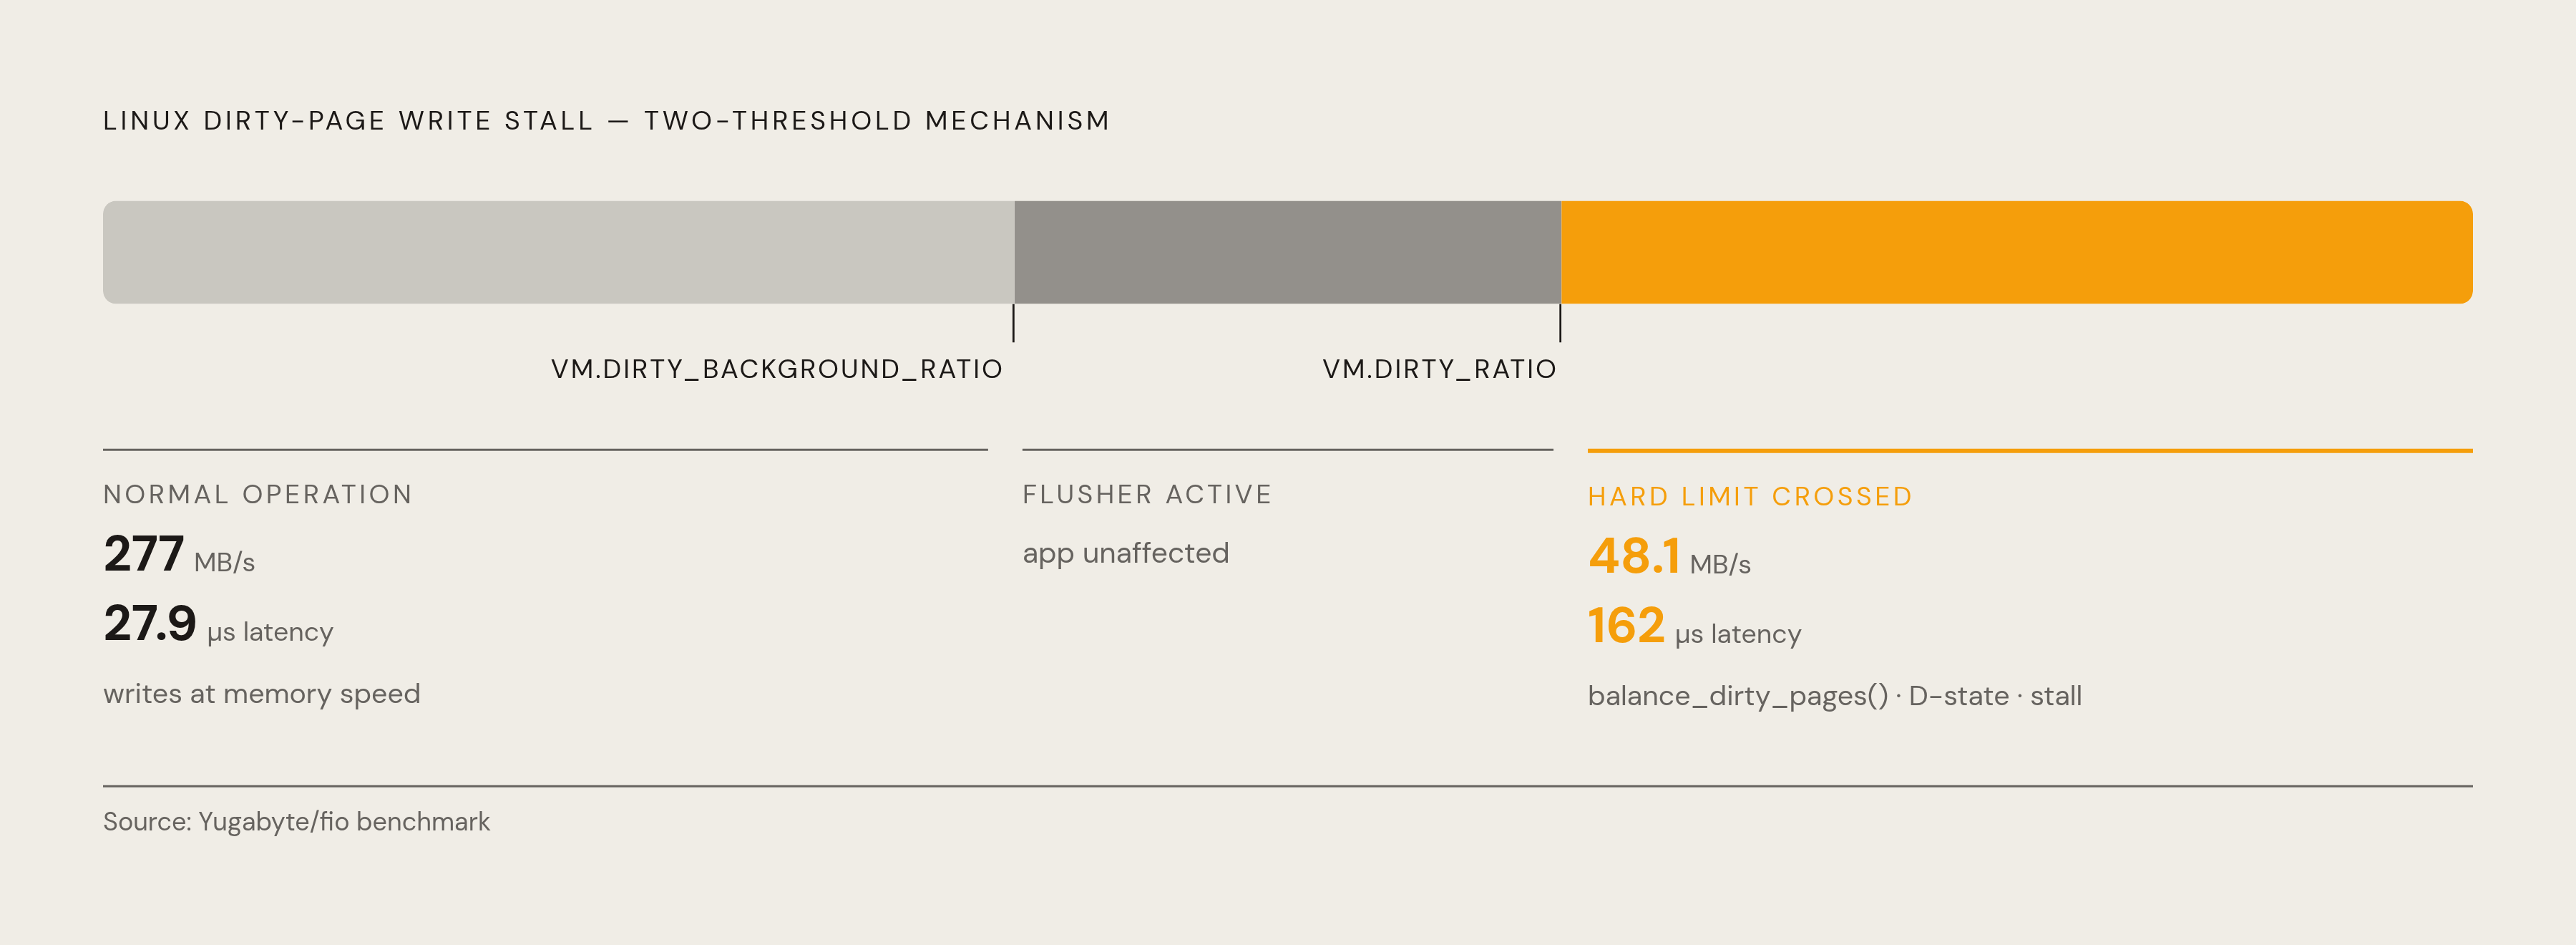
Buffered writes don't go to disk right away. They land in the page cache, get marked "dirty," and the write call returns immediately, at memory speed, while the actual disk write gets deferred. The kernel manages that deferral using two thresholds, both expressed as a percentage of available memory.
Crossing the soft limit wakes up the background flusher thread, which starts writing dirty pages out. Nothing user-facing happens yet, the app keeps humming along. Crossing the hard limit makes the kernel call a function called balance_dirty_pages(), which stalls the writing process outright, parked in uninterruptible sleep (D-state) until enough dirty pages get flushed to bring things back under control. The app can't see this happening. It just sees its write call suddenly taking forever.
The numbers here are not subtle. Yugabyte's fio measurements show write bandwidth dropping from 277 MB/s down to 48.1 MB/s under memory pressure, a fall of several times over that hits like a wall, while average write latency climbs from 27.9 microseconds to 162 microseconds. That's not a gentle slowdown; that's a wall.
And it compounds. If an app writes faster than storage can absorb, dirty pages pile up past the hard limit, which throttles every subsequent buffered write, which slows down how fast the backlog clears, which keeps the throttle engaged longer. It's a bit like a traffic jam that causes the accident that causes the traffic jam. The symptom in production is a write latency that looks like it "spontaneously" jumped from memory speed to disk speed, with backend processes stuck in D-state as the tell.
Worth asking, when this happens: is it a bad dirty-ratio configuration, or is the app just writing faster than storage can ever flush? Both look identical from the outside. Knowing the mechanism is the only way to tell which one you're actually fixing.
What correctly tuned dirty-page parameters look like in practice
Both thresholds are tunable, through vm.dirty_ratio and vm.dirty_background_ratio (or their byte-based cousins). Turning the soft threshold down wakes the flusher earlier and more often, keeping the dirty-page count well clear of the stall cliff. The cost is a bit less batching efficiency, since the kernel has less room to group writes together.
For write-heavy workloads, that trade is usually worth it. A steady drip of flusher activity at a low watermark beats a cycle of burst-then-stall every time, because predictable latency affects most production systems more than peak throughput does. Read-heavy workloads with occasional writes can afford more headroom before the flusher kicks in, since there's less dirty-page pressure to begin with.
One catch: tuning these thresholds in isolation doesn't help if available memory itself is shrinking. Dirty ratio is a percentage of available RAM, so if some other process on the box starts eating memory, the absolute dirty-page limit tightens on its own, with no config change involved. Nobody touched vm.dirty_ratio, and yet the stall threshold moved anyway.
Get it right, though, and the same mechanism that causes the stalls becomes the thing that makes buffered I/O fast. Write-back batches disk operations and smooths out throughput in a way synchronous, one-at-a-time writes never could. Tuning works within the page cache's design, but some workloads need something the page cache was never built for.
The cost of bypassing the page cache
O_DIRECT skips the page cache. The application takes over its own buffering, which only pays off when the app genuinely understands its own data access patterns better than the kernel's general-purpose heuristics do.
Most databases don't take that bet. PostgreSQL and RocksDB default to buffered I/O, because the kernel's read-ahead and write-back logic tends to beat naive application-level buffering in practice.
ScyllaDB is the exception worth studying. It bypasses the Linux page cache completely on reads and runs its own row-based cache instead, a design Tomasz Grabiec laid out at P99 CONF 2025. The reasoning: 4 KB page granularity causes read amplification on rows that don't line up with page boundaries, spatial locality is often weak, and blocking page faults introduce context switches that hurt tail latency. Cassandra, by contrast, layers a key cache, a row cache, and the Linux page cache on top of each other, each sized with a fixed limit in cassandra.yaml, none of which can right-size itself as the workload shifts. ScyllaDB's cache tunes its own size dynamically, and on a miss it kicks off an async continuation instead of blocking the thread, which is part of how it handles over a million ops per second at single-digit millisecond P99 latency.
Building a cache subsystem that actually beats the kernel's is a serious engineering lift. It only makes sense for database engines with the resources to do it right. For most applications, buffered I/O plus sensible tuning is simpler, and often just as fast.
Memory-mapped I/O as a middle path between buffered and direct
Memory-mapped reads skip the syscall dance. Instead of open, read, close, and a copy into user space, a mapped read hands back a pointer straight into the page that's already sitting in the cache.
That syscall overhead is easy to underestimate. Even on a warm cache, a file-per-entry approach pays for open, read, and close on every single hit, plus a copy out of kernel memory. Under concurrency, all those threads hammer the same shared kernel structures, dentry locks, inode locks, the file descriptor table, and that contention appears as latency that is unrelated to the disk.
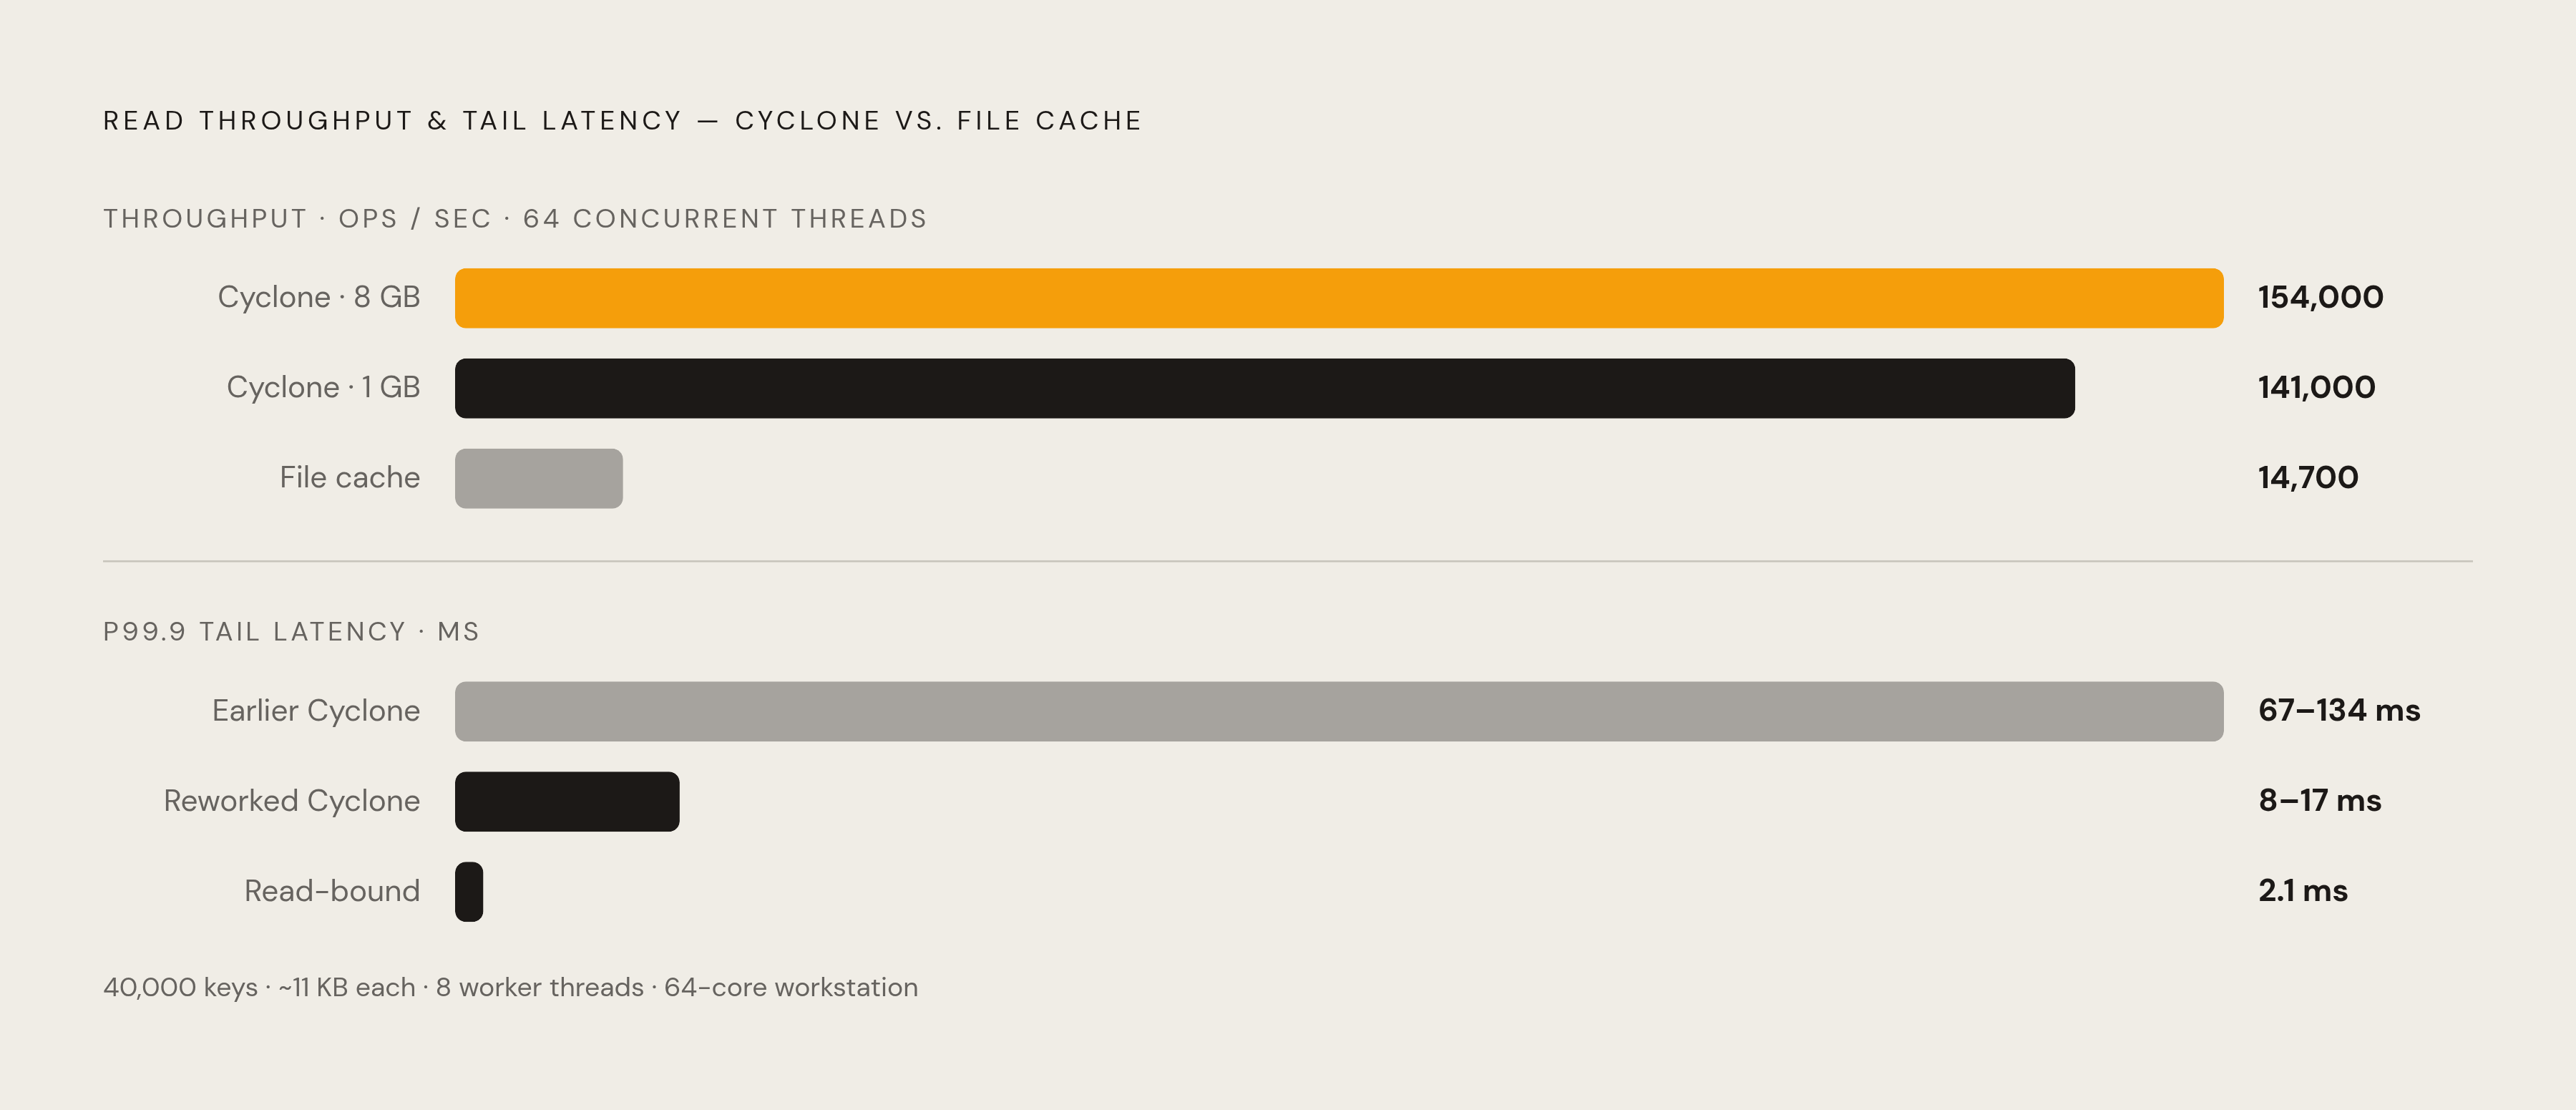
A benchmark called Cyclone, run against mod_pagespeed and ModPageSpeed builds in mid-2026, makes the gap concrete. The setup: 40,000 keys around 11 KB each, 8 worker threads, a Zipfian read/write/delete mix, on a 64-core workstation. At 64 concurrent threads with 100-byte objects, Cyclone hit several times as many reads per second as the file cache, a gap of roughly the same order the earlier throughput comparison showed. Single-threaded, the file cache can actually edge ahead on a warm NVMe drive, since a warm read there is just a page-cache copy with nothing else going on, but that edge disappears the moment concurrency occurs.
A rework published ten days later made concurrent reads lock-free and dropped the per-write sync call, and the gains got bigger. In the read-bound regime, reworked Cyclone hit several times over the throughput of the file-per-entry cache, with roughly half of that gain coming from the rework itself. Concretely: 154,000 ops/sec versus 14,700 in an 8 GB read-bound test, and 141,000 versus 14,700 at 1 GB. Tail latency told the same story. P999 latency under memory pressure ran 67 to 134 milliseconds on the earlier Cyclone build, 8 to 17 milliseconds after the rework, and down around 2.1 milliseconds in the pure read-bound case. Across object sizes at 64 threads, Cyclone's advantage held steady, several times over at 100 bytes, at 10 KB, and at 1 MB, narrowing somewhat as object size grew.
None of this is really about web caching. It's about what happens whenever a pile of threads reads concurrently against one shared file, and that pattern occurs constantly in AI data-loading pipelines.
How the page cache interacts with object storage
The page cache was designed assuming a local disk sits behind it. Object storage, S3, GCS, R2, Azure Blob, breaks that assumption completely, because "storage" there is a remote HTTP endpoint, and a cache miss means a network round trip, not a disk seek.
That changes what the numbers even mean. Standard IOPS and latency benchmarks don't translate cleanly to object storage, because performance there depends as much on the network path as on the storage hardware itself, a point worth keeping in mind about object storage benchmarking generally. Cold object storage is also priced and bought on cost per gigabyte, not on latency, which is a fine trade-off for archival data and a bad one the moment an AI workload needs that data fast.
A GPU sitting idle while a cache miss reaches all the way back to S3 is burning a wildly more expensive resource than a miss that reaches local NVMe would. The page cache, built for the disk era, has no mechanism to close that gap on its own. What's needed is a caching layer that sits between the object store and the compute, doing the same job the page cache does for local disk, just built for the latency profile of a network endpoint instead of a spinning platter or a local fast drive.
Why storage latency becomes the binding constraint in AI training and inference
An H100's memory bandwidth can top 3 TB/s. Network-attached storage, even good storage, tends to deliver 10 to 40 GB/s. That's a wide gap spanning roughly one to two orders of magnitude, and it means the GPU finishes chewing through its batch and then just waits, which is about as expensive a form of waiting as exists in computing right now.
Image training pipelines can demand something like 4 GB/s of read throughput per GPU, and multiply that across hundreds of GPUs running at once, and the storage layer either keeps up or preprocessing becomes the bottleneck for the entire cluster. Mixed-precision training with BF16 and techniques like FlashAttention have made the compute side faster, which sounds like good news, except it just makes the storage gap more visible, not less. The GPU was never the slow part to begin with.
Checkpoint writes are where this bites hardest. Periodic checkpoint I/O stalls the training loop outright, GPUs sit idle at epoch boundaries, and idle time across a large cluster burns real money by the hour. SentiSight's AI infrastructure report projects that inference will make up roughly two-thirds of all AI compute in 2026, and inference can account for 80 to 90% of a production AI system's lifetime cost. Storage latency on every single inference call adds up fast at that volume.
MinIO's 2026 AI storage report puts a number on how widespread this actually is: more than half of organizations report data and storage bottlenecks limiting their AI performance, and 57% say their data simply isn't AI-ready. Global AI infrastructure spending crossed $250 billion in 2025, which tells you the constraint isn't theoretical, it's already visible in budgets. The working set at this scale is too big for a single node's RAM, and the cost of any stall that does occur is much higher than anything a local workload would ever produce.
How paging ideas migrated into LLM inference: PagedAttention and its trade-offs
Autoregressive decoding grows a key-value cache with every token generated and every concurrent request served. Early serving systems handled this by reserving a contiguous block of memory upfront for each sequence, guessing at how long it might run.
Guessing wrong is expensive. Reserved-but-unused space, internal fragmentation, external fragmentation, it all adds up, and Kwon et al. found effective memory utilization in earlier systems could fall as low as 20.4%. Four-fifths of the memory set aside for a task, just sitting there unused.
PagedAttention, introduced by Kwon et al. in 2023, fixes this by lifting an idea straight out of operating system design: store the KV cache in fixed-size blocks, and let those blocks live anywhere in physical memory, not just contiguously. A block table maps the logical sequence to wherever its physical blocks actually sit, new blocks get allocated as needed, and blocks can even be reference-counted and shared across related decoding paths using copy-on-write. It's virtual memory paging, just aimed at GPU memory instead of RAM.
The vLLM paper reports substantial results: a sizable throughput improvement over FasterTransformer and Orca, and KV-block sharing that saved 6.1 to 9.8% of memory on parallel sampling and 37.6 to 55.2% on beam search. A 2024 survey of LLM serving systems went as far as calling PagedAttention an industry norm at this point, with support baked into TGI, vLLM, and TensorRT-LLM.
It's not free, though. A 2025 paper on a system called vAttention points out that PagedAttention forces attention kernels to be rewritten around the paging abstraction, which adds software complexity, portability headaches, and real execution overhead. vAttention's counter-proposal keeps the KV cache contiguous in virtual memory and instead uses demand paging for the physical allocation underneath it, which is basically the mmap philosophy applied here instead of explicit block management. The general-purpose paging mechanism is genuinely powerful, but it's not free, and a team with enough domain-specific context can sometimes build something narrower that beats it, a tension that recurs everywhere else in this piece.
A filesystem cache layer as a practical resolution to the object-storage latency gap
Every problem in this piece points at the same fix. AI workloads need something that behaves like the page cache, fast local reads, deferred and batched writes, working-set awareness, but built for the specific gap between GPU compute speed and object storage's network-bound latency.
That's the role a filesystem cache layer plays sitting in front of object storage: NVMe drives local to the compute, holding the active working set, so a GPU reads from something local and fast instead of reaching across the network for every batch. It's the same core idea the Linux kernel had decades ago, keep hot data close, defer and batch the expensive stuff, just re-applied to a world where "the disk" is now an object store hundreds of miles away.
The mechanism doesn't change. What changes is the distance the cache has to cover, and the price of getting a miss wrong.