Data Loading Bottlenecks in PyTorch and TensorFlow Training Pipelines
GPU utilization dashboards miss data loading bottlenecks that waste most training time.
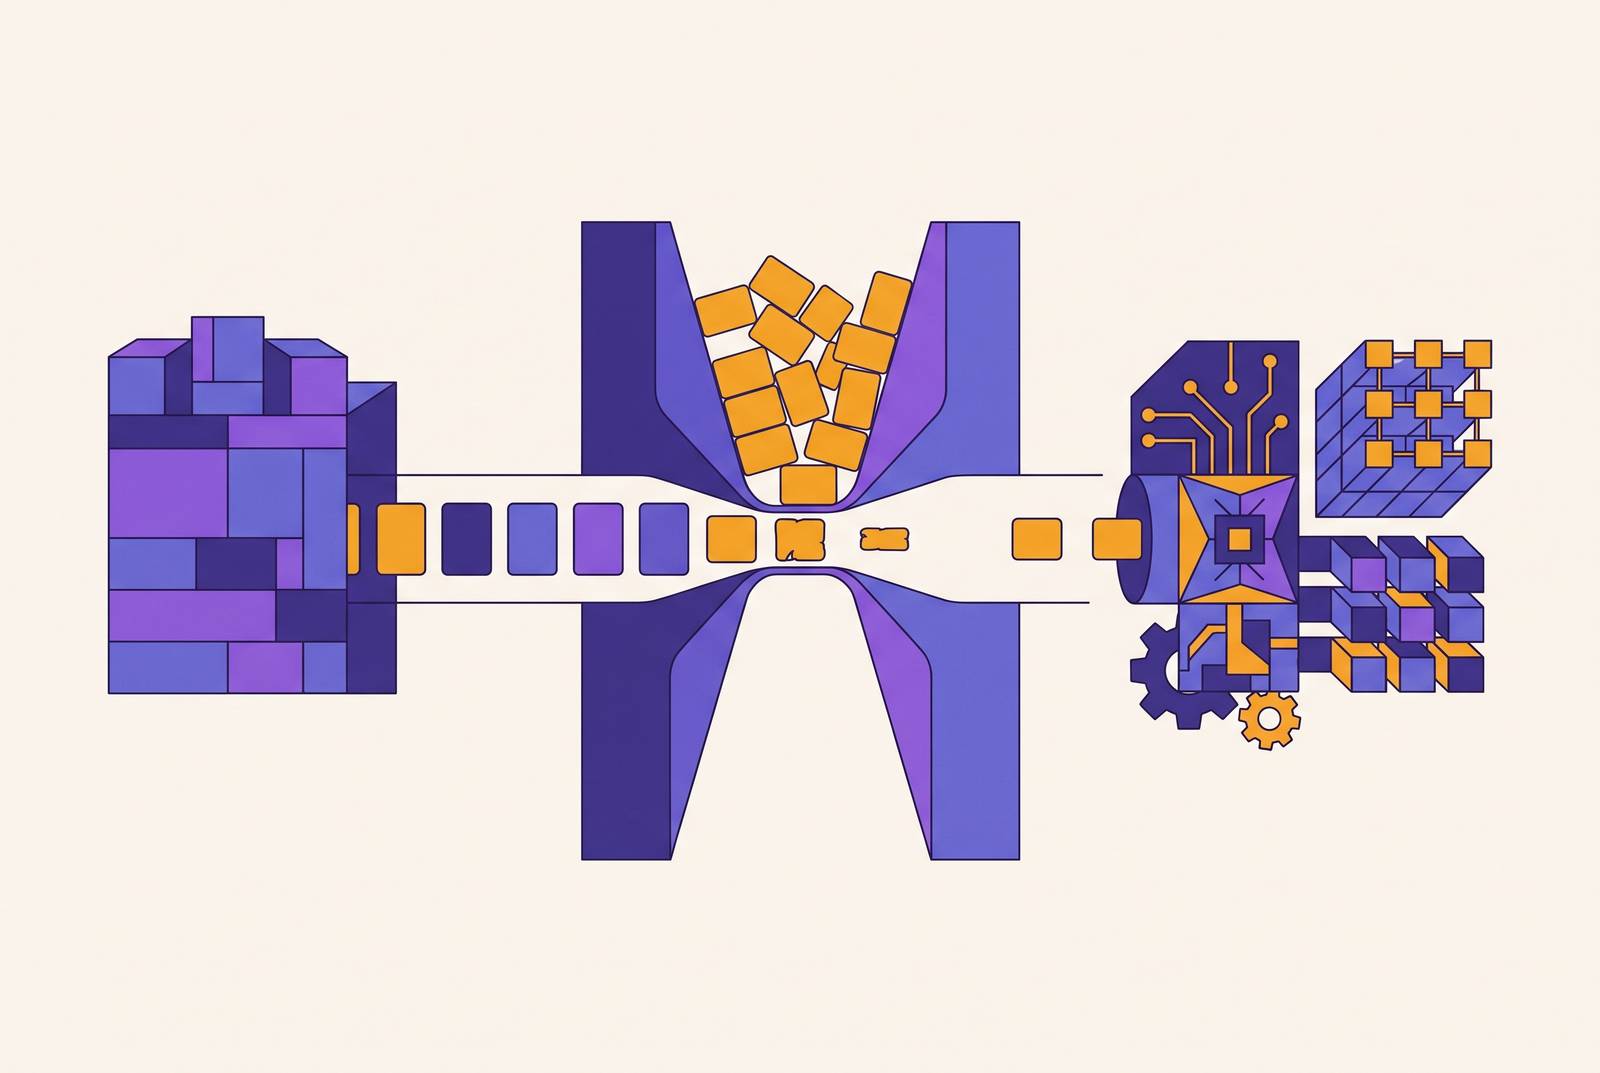
A GPU can show up as fully allocated on every dashboard your team watches and still spend most of its time doing absolutely nothing useful. That gap between "allocated" and "actually working" is the whole story behind most slow training runs, and it starts with how the training loop is built. Every run follows the same basic cycle: load a batch from storage, move it to GPU memory, run the forward and backward passes, update the weights, then start over. If the load step is slow, every step after it waits in line, no matter how fast the GPU itself is.
Run the naive version of this loop (fetch a batch, sit around, hand it to the GPU, train, repeat): utilization drops low enough to make clear the real holdup is upstream, in data loading or preprocessing. The dashboards don't catch this because they were never built to. Cluster and cloud monitoring tools report allocation, not throughput, so a job holding a GPU shows as "running" even while that GPU sits blocked on a read the storage layer hasn't delivered yet. It's a bit like checking whether a restaurant is open by seeing if the lights are on, while the kitchen's actually out of plates.
That distinction decides where engineers spend their time. Teams chasing a utilization problem usually start with compute tuning, hyperparameters, or architecture changes, because those are the levers the dashboard points to. None of that touches the pipeline actually feeding the GPU. The fix never arrives, and the GPU bill keeps climbing anyway.
The hardware gap that makes storage the binding constraint
Part of why this keeps happening is physical: a monitoring blind spot alone wouldn't explain it. Modern GPU memory subsystems move data at a rate conventional storage simply can't match, and the shortfall is an order of magnitude or more, wide enough that even a carefully tuned pipeline is working against a structural disadvantage before a single line of code runs. Compute happens in microseconds; storage reads happen in milliseconds or worse, and across thousands of training steps those small delays stack into large stretches of idle GPU time.
The mismatch is clearest when two very different I/O patterns land on the same job. Data loading generates billions of small, random reads, while checkpointing generates occasional but massive sequential writes, often in the terabyte range. Storage tuned for one of those patterns tends to choke on the other, and any weak link produces a visible stall regardless of how well everything else in the pipeline is configured. Checkpointing deserves a fuller look later on, but the short version is that when every rank in a distributed job writes its state at once, storage that can't absorb that burst halts the entire run for as long as the write takes.
None of the software fixes discussed later (parallel workers, prefetching, caching) change this physical ceiling. They recover the headroom a misconfigured pipeline is wasting, but they can't out-engineer a storage layer that's structurally too slow for the GPU sitting on top of it. That ceiling is why the next section matters: knowing whether a stall is fixable in software, or baked into the hardware, changes what's worth doing about it.
Software and hardware failure modes in pipeline bottlenecks
Most stalls turn out to be fixable without buying anything new. Plumber's analysis of more than two million ML jobs at Google found that a large share of training jobs repeatedly stall waiting on data, and that most of those stalls trace back to software bottlenecks rather than genuinely exhausted hardware. In plain terms: the CPU and memory aren't maxed out, the pipeline is just configured badly.
Hardware bottlenecks look different and need different medicine. If CPU cores, disk I/O, or memory are genuinely saturated, the fix is resizing the instance, changing storage tiers, or shifting preprocessing onto the GPU, and distinguishing this from a software bottleneck before acting avoids wasted effort. Confusing the two wastes time: there's no benefit to adding workers to a pipeline that's already CPU-bound, and no benefit to upgrading an instance to fix a missing prefetch call.
Part of why this confusion is so common comes down to how approachable these tools are. The PyTorch DataLoader and TensorFlow's tf.data both hide a lot of complexity behind friendly, simple APIs, and the defaults work well enough to ship. That is why they go untuned. A third category sits alongside the software and hardware split: pipelines built on object storage often suffer from latency and HTTP overhead that look like software misconfiguration but are actually architectural, a topic addressed in a later section on storage-layer choices. That third category gets its own treatment later. For now, the useful mental model is a three-way sort, software, hardware, and storage architecture, because that's the checklist the next two sections put to work.
Surfacing the exact stall with PyTorch Profiler and TensorBoard
Diagnosis beats guesswork, and PyTorch Profiler paired with the TensorBoard plugin gives engineers operator-level visibility into exactly where time disappears, separating a data-loading stall from a genuine compute bottleneck. Chaim Rand's profiling walkthrough lays out the basic method: wrap the operations under suspicion with torch.profiler.record_function, run the profiler with TensorBoard tracing turned on, then read the resulting trace to see which operations are eating time in the worker processes versus on the GPU itself.
The payoff is a view that lines up DataLoader time against GPU kernel time side by side. A DataLoader bar that's long relative to the GPU kernel bar means the input pipeline is setting the pace. In practice, the usual suspects are custom transforms, things like domain-specific augmentations, color space conversions, or mask dilation. These run in Python worker processes, get tangled up in GIL contention when they sit outside compiled graph operations, and don't look expensive in isolation. Their cost only becomes obvious once the trace adds up what they cost across every parallel worker running them.
Profiling a pipeline once rarely tells the whole story. The practical approach is to profile, find the single hottest operator, fix it, then profile again: removing one bottleneck changes the pipeline's balance of work and so creates a new hottest operator, one that was previously masked by the one just fixed. Plumber turns that manual loop into something closer to a repeatable process: its tracer measures per-operator throughput and resource use (CPU, disk, memory) through what it calls a "resource accounted rates" methodology, and its rewriter then automatically adds parallelism, prefetching, and caching, obtaining speedups of up to 47× for misconfigured pipelines. Low CPU and memory utilization alongside an underdelivering pipeline points to a software fix, while saturated CPU and memory point to a hardware limit. Whichever side of that line a stall falls on decides which remedy, framework tuning or infrastructure change, actually applies.
Diagnosing tf.data pipeline stalls in TensorFlow
TensorFlow's tf.data pipeline runs into the same basic categories of stall as PyTorch's DataLoader, but the tooling and the specific misconfigurations that trigger them look different enough to deserve their own walkthrough. The most common culprit is a dataset.map() call running custom Python functions with num_parallel_calls left unset, or pinned to some fixed low number instead of tf.data.AUTOTUNE. That turns a step meant to run in parallel into a single-threaded chokepoint, and the profiler will show it as the hard ceiling on the whole pipeline.
The GIL problem that showed up earlier in PyTorch worker processes has a direct parallel here. Custom preprocessing code or specialized augmentations that run outside the compiled TensorFlow graph hit the same GIL contention, so adding parallel calls produces sublinear speedup instead of the clean scaling you'd expect. The profiler shows worker processes fighting each other for the interpreter rather than running cleanly in parallel.
TensorFlow's built-in profiler, viewed through TensorBoard, includes an input pipeline analyzer that names the specific bottleneck stage and tells you whether it's CPU-bound, I/O-bound, or just waiting on the iterator. Check whether tf.data.prefetch(tf.data.AUTOTUNE) sits at the end of the pipeline. tf.data.prefetch(tf.data.AUTOTUNE) at the end of the pipeline is the minimum configuration needed to overlap data prep with GPU execution, and leaving it out appears in the profiler as CPU and GPU activity alternating instead of overlapping.
Shuffle buffer size is its own small minefield. Too small, and batches come out biased. Too large, and memory runs out, forcing the OS to page and introducing an entirely different kind of stall, one the profiler's memory view will flag separately from the input pipeline analyzer.
Framework-native fixes: parallelism, prefetching, pinned memory, and caching
Once a profiler has pointed at the actual stall, a small set of DataLoader and tf.data configuration changes clears up the most common software bottlenecks, and trying these should always come before touching infrastructure. Each one addresses a progressively narrower slice of the problem.
Parallel workers come first, because an underparallelized loader is the single most common stall:
PyTorch's DataLoader defaults to num_workers=0, which runs all data loading on the main process, and that forces the GPU to sit idle while it waits for the CPU to finish preprocessing the next batch.
- The right number of workers depends on CPU core count, disk speed, batch size, and how expensive the transforms are. A sensible starting point is one worker per physical core, then adjust while watching CPU and GPU utilization together.
- In tf.data, setting num_parallel_calls to tf.data.AUTOTUNE lets the runtime adjust parallelism on its own, which works better than a fixed number whenever transform cost varies across the dataset.
Prefetching comes second, because it's what actually overlaps loading with compute once workers are parallelized:
- Prefetching lets the GPU train on batch N while the CPU loads and prepares batch N+1, removing the sequential wait that tanks utilization in a naive loop.
- PyTorch's prefetch_factor sets how many batches each worker stages ahead of time; tf.data's prefetch(tf.data.AUTOTUNE) does the equivalent job with the buffer size tuned automatically.
- AlgoMaster's guide to ML system design notes that parallel workers, prefetching, and pinned memory together are generally enough to keep GPU utilization high across most workloads.
Pinned memory comes third, and only matters once the CPU-to-GPU transfer itself is the measurable delay:
- Data sitting in ordinary pageable CPU memory has to be copied into page-locked memory before the DMA engine can hand it to the GPU. Setting pin_memory=True in the PyTorch DataLoader allocates tensors directly in pinned memory and skips that copy.
- This one only pays off when the memory copy between DataLoader output and GPU kernel launch is the visible delay in the profiler. Turning it on blind, without confirming that's the stall, won't do much.
Caching comes last, because it requires profiling to know where it actually helps:
- Transforms that are expensive but deterministic (color normalization, fixed resizing) should be computed once and reused, not recalculated every epoch.
- Plumber automates the decision: by modeling the cost of each operator against how often the dataset gets reused, it inserts cache nodes only where caching produces a net win under the available memory, and that mechanism alone has produced end-to-end speedups of over 50% compared to other state-of-the-art tuners.
Moving preprocessing off the CPU with NVIDIA DALI
Sometimes the CPU isn't misconfigured, it's just out of room. When framework-native parallelism has hit its ceiling and the CPU is genuinely the saturated resource, the next move is shifting preprocessing work onto the GPU with NVIDIA DALI, which removes the CPU ceiling entirely without requiring new hardware.
DALI, short for Data Loading Library, is a portable, open-source library for decoding and augmenting images, video, and speech. It overlaps preprocessing with training rather than running them sequentially on separate hardware, so the GPU that's training the model is also the GPU doing the decode and augmentation work. It works as a drop-in, high-performance alternative to the built-in data loaders in PyTorch, TensorFlow, PaddlePaddle, and JAX, which solves a separate, nagging problem: preprocessing code written for one framework usually needs a rewrite to run on another. DALI handles that portability at the preprocessing layer, so the same pipeline logic travels across frameworks instead of getting rebuilt each time.
The operations DALI accelerates, decode, random crop, resize, color space conversion, normalization, are the exact same transforms that keep turning up as hotspots in PyTorch Profiler traces and TensorFlow's input pipeline analyzer. That's not a coincidence. Those are the steps expensive enough to saturate a CPU and simple enough, computationally, to run efficiently on a GPU instead. Once a profiler has pointed to one of these operations as the stall, moving it into DALI is the direct fix, no instance resizing, no storage upgrade, just relocating the work to hardware that was already sitting there, underused, the whole time.